Programming-language migration and the staying power of Java
An interpretation of JetBrains Research data on language migration, ecosystem turnover, and the JVM.
This article is based on JetBrains Research’s analysis of programming-language migration. The charts below are from that study but the interpretation below is mine.
The new "main languages" devs switch to
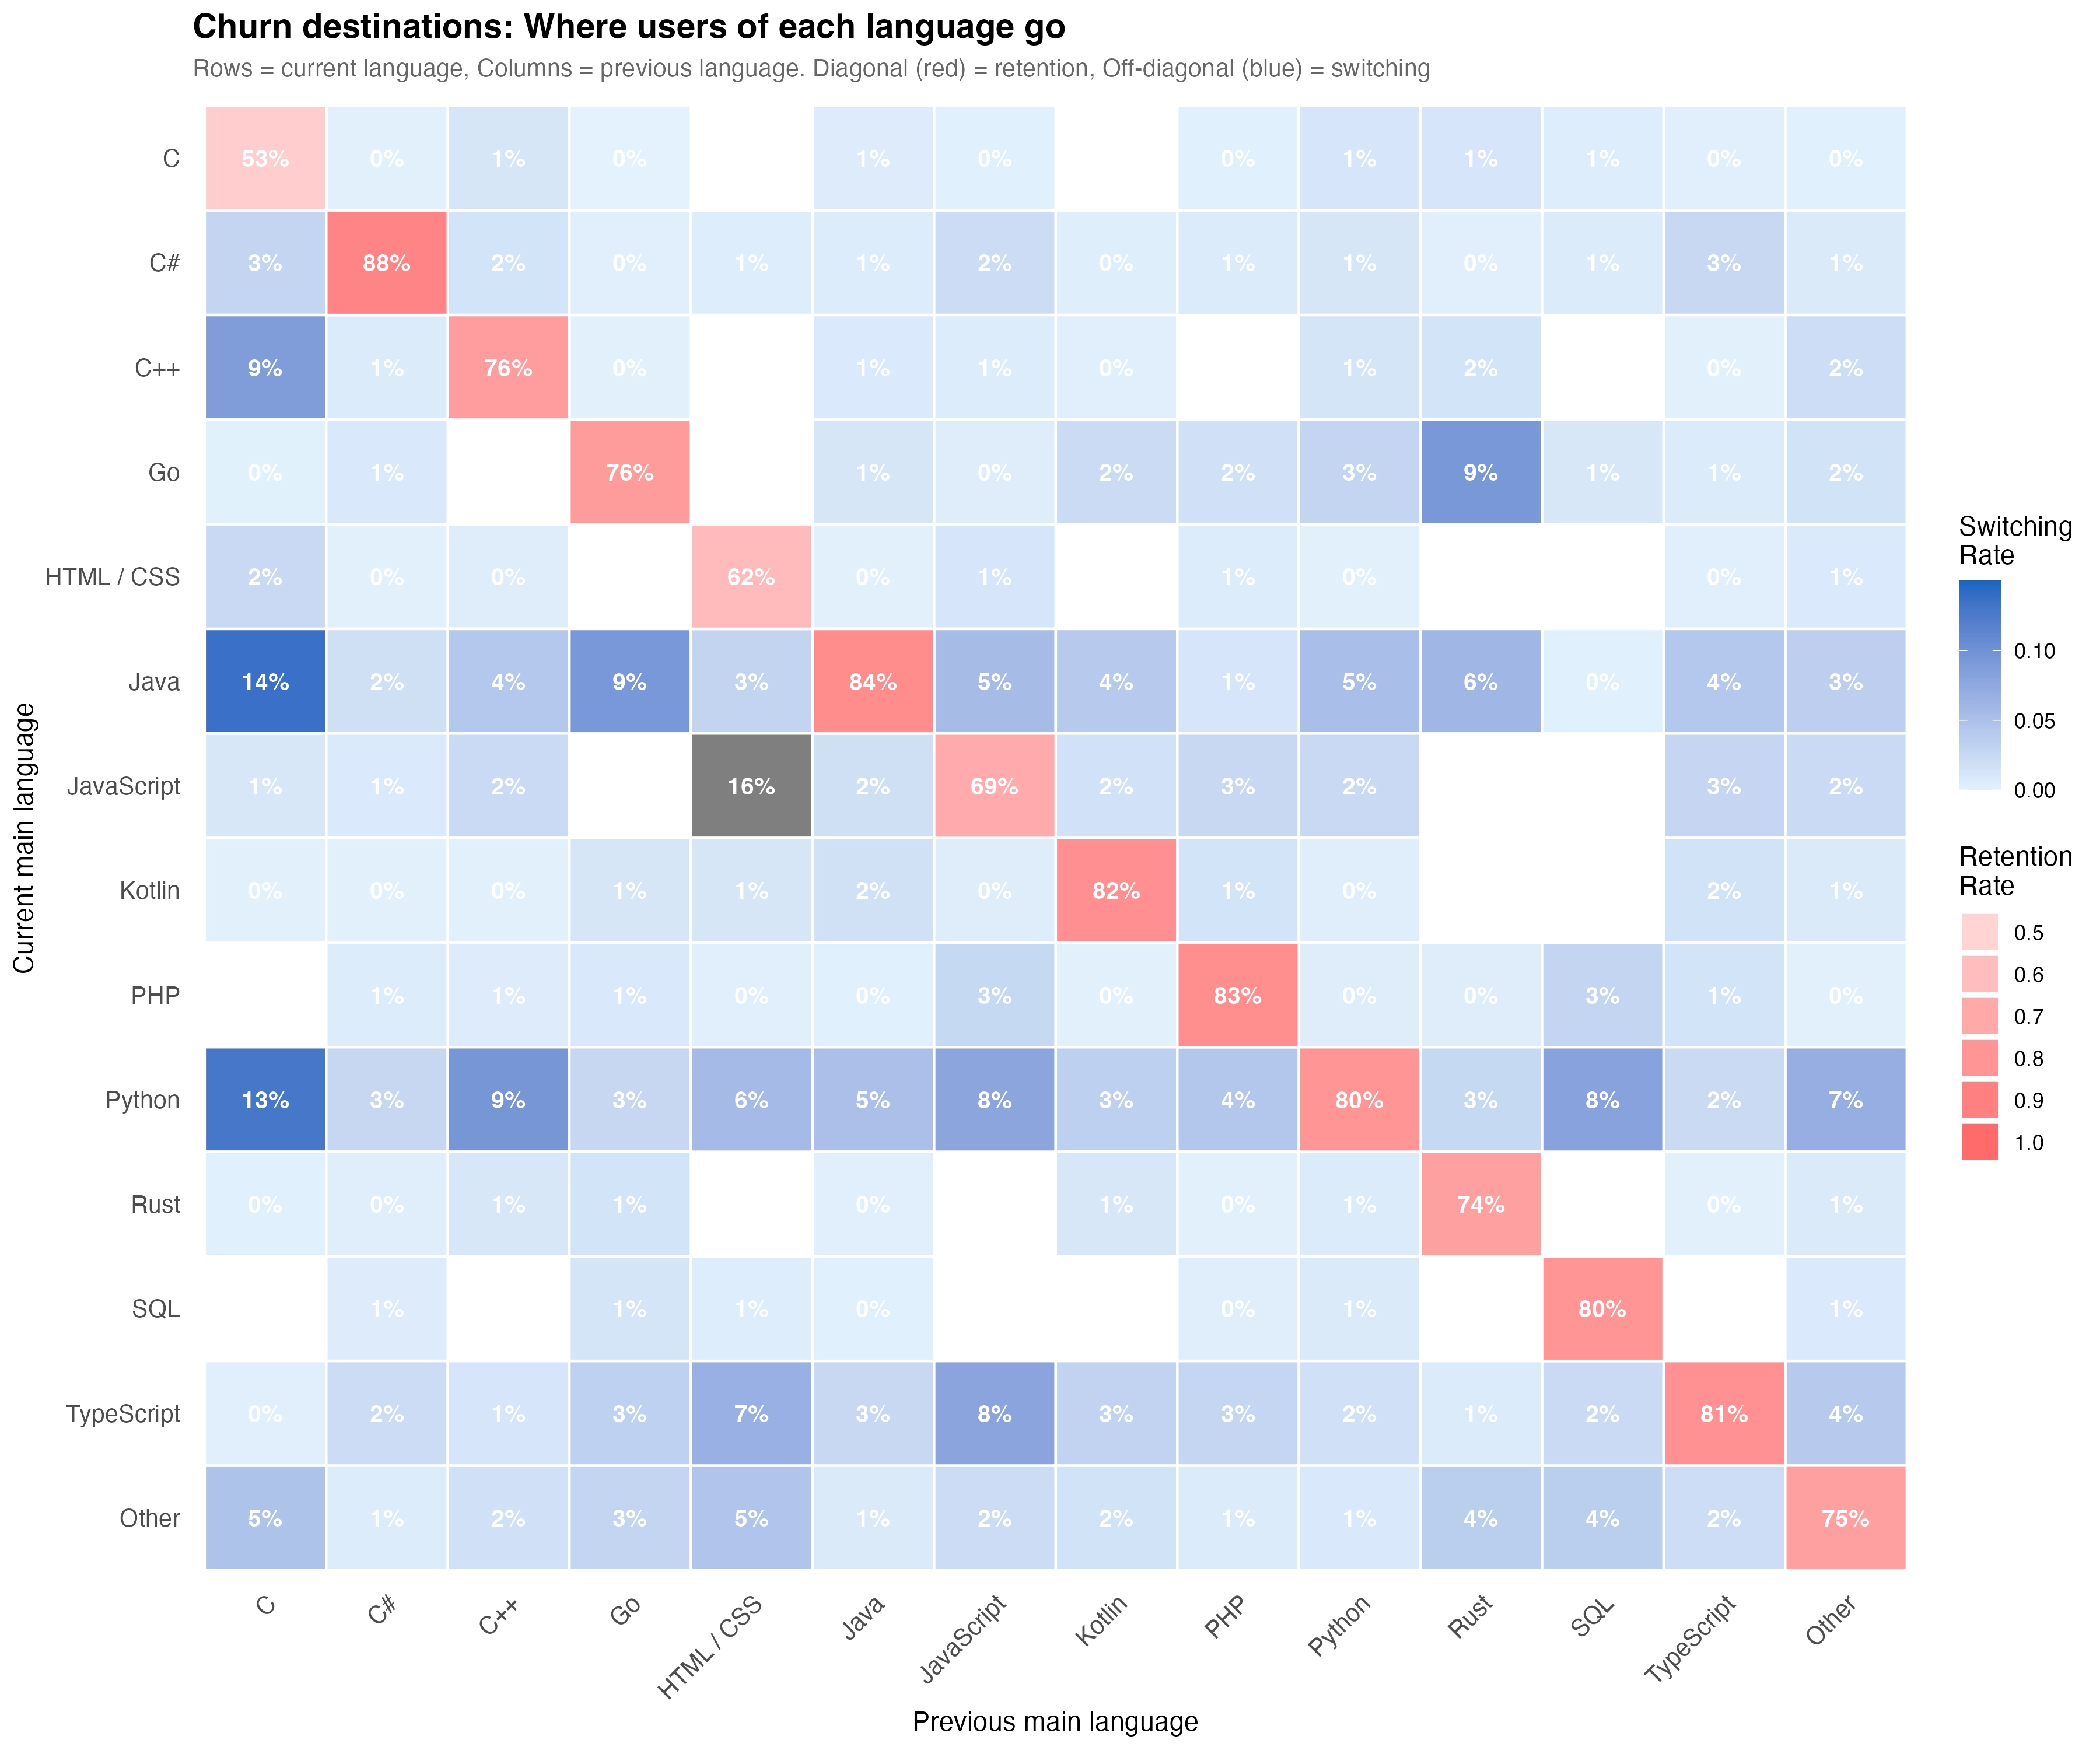
The survey's migration destinations are shown below in both the weighted figures used for the report and the unweighted respondent figures.
| Rank | Weighted destination | Weighted share | Unweighted destination | Unweighted share |
|---|---|---|---|---|
| 1 | Python | 20.9% | Python | 72% |
| 2 | Java | 16.1% | Java | 60% |
| 3 | TypeScript | 13.5% | TypeScript | 39% |
| 4 | JavaScript | 10.5% | JavaScript | 34% |
| 5 | Other | 7.3% | Other | 33% |
| 6 | Go | 7.0% | Go | 22% |
| 7 | C# | 5.7% | C++ | 17% |
| 8 | C++ | 4.8% | C# | 16% |
| 9 | Kotlin | 4.1% | PHP | 10% |
| 10 | C | 2.5% | Kotlin | 8% |
| 11 | PHP | 2.3% | C | 5% |
| 12 | Rust | 2.1% | HTML / CSS | 5% |
| 13 | SQL | 2.0% | Rust | 5% |
| 14 | HTML / CSS | 1.3% | SQL | 5% |
My interpretation
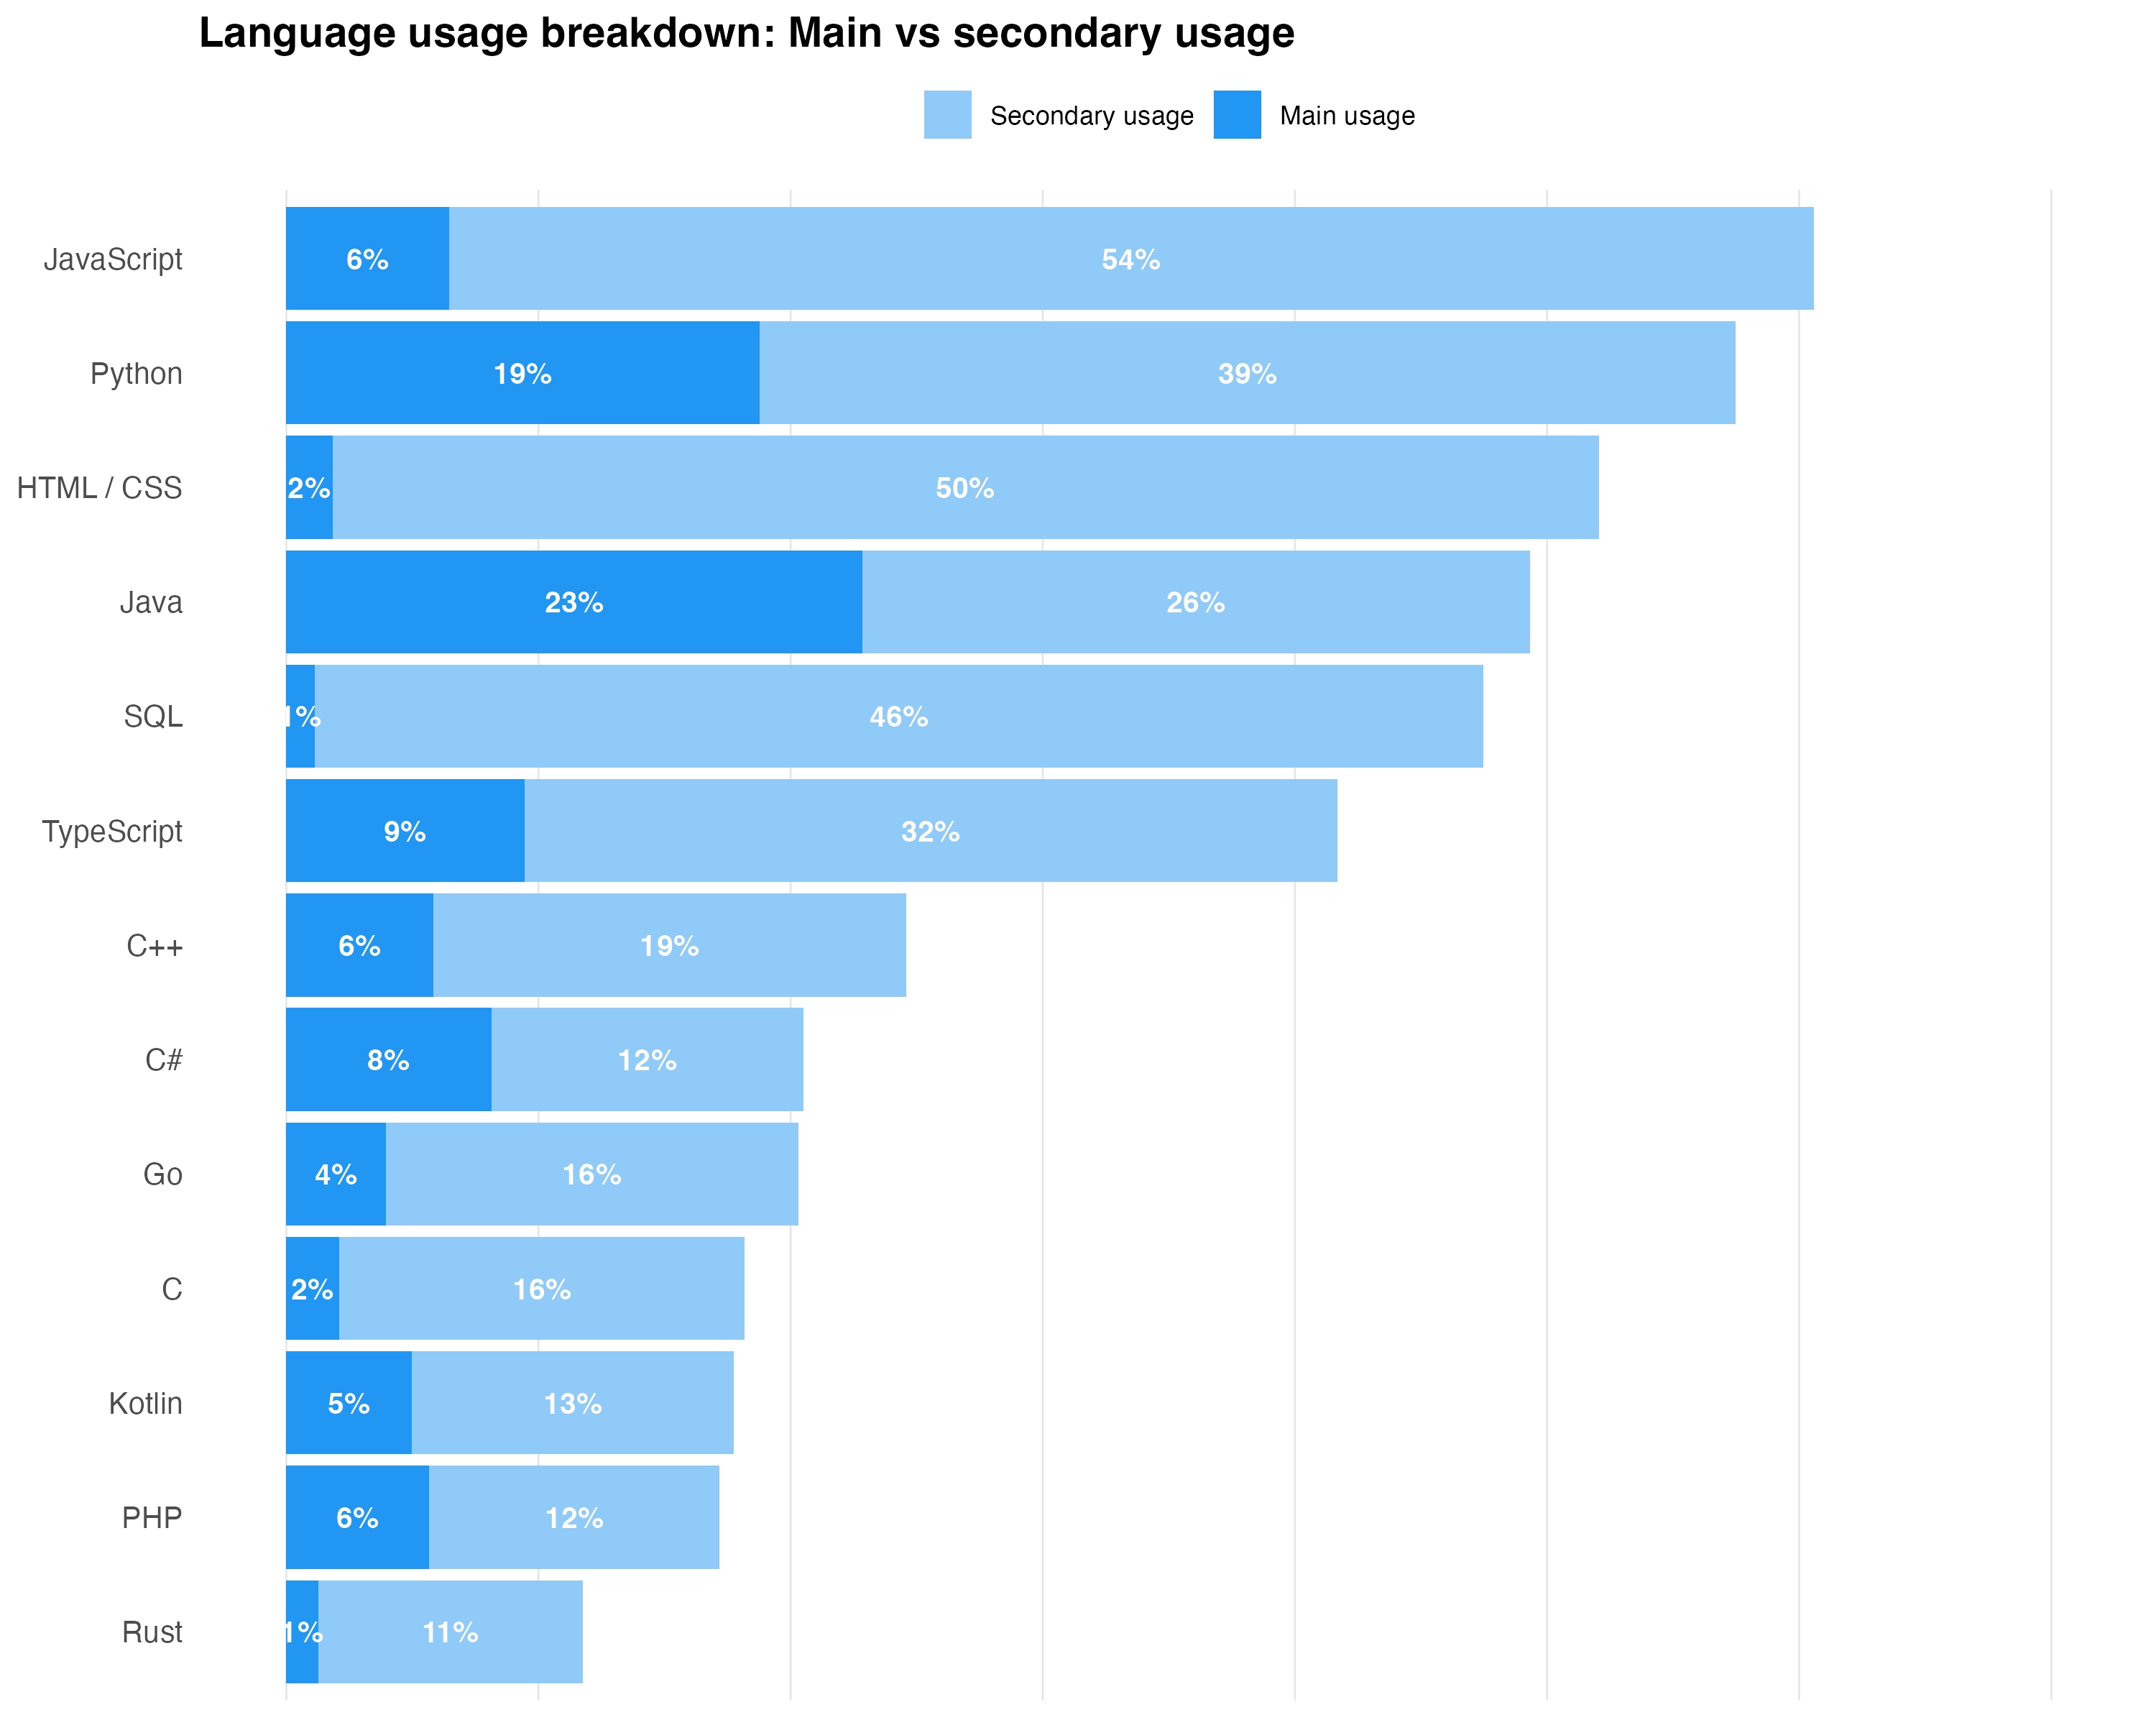
– When devs move to a new "main language", Java comes in second place (after Python) despite a practically constant market share. In other words, the JVM ecosystem remains dominant, but with significant turnover.
– In addition, modern and more expressive languages such as Kotlin, Go, and Rust, occasionally imagined as replacements for "legacy Java", never actually displaced Java. Why wipe out a complete and mature ecosystem? Instead, they serve as niche additions to Java monoliths. Go for ease of use and low memory footprint in microservices and network infra, Rust for core services that require strict memory safety, Kotlin for Android (with cool improvements for Native/AOT/KMP), etc. These languages also see the largest transition back to Java, which reinforces the fact that Java remains the core platform they often support rather than replace.
Java/JVM is genuinely good, has seen massive improvements (virtual threads, pattern matching, sealed classes, ZGC), and will continue to improve with value objects (a preview of which landed in OpenJDK back in May!), the continuation of Project Loom, and more.
Much like how a now "graybeard" language like Lisp brought us concepts that modern devs take for granted, the standout features of today's hot new languages are steadily being absorbed by the JVM. Goroutines and Kotlin Coroutines inspiring Project Loom are just one example. Paul Graham's "Revenge of the Nerds" has transmuted into the unstoppable momentum of the safe corporate giant.
– Due to the explosion of AI and the concept of "LLM-friendly languages", Python is indeed the primary choice for devs moving to a new main language. BUT its overall net growth in total dev share is quite modest (roughly +0.76% of all devs, or +4% self-relative), and it has large turnover (Python devs most often switch to Java and Go). This shows, in my opinion, that it acts more as an industry-wide transit hub rather than a one-stop shop replacing your typical backend stack. A significant portion of this "switch" is likely driven by the massive increase in high-level orchestration of ML code, which will remain written in good old C++.
– Surprisingly, JS devs remain loyal to pure JS despite the (partially) LLM-driven TypeScript boom 🤔. Is it an identity issue where "TS is just JS with types", so only newcomers label themselves "TypeScripters"?
– Perhaps not as surprising, Rust has incredible mindshare and loyalty but tiny market share, accounting for just 2.1% of global switchers. The data shows basically 0% of C devs and 1% of C++ devs moved to Rust. It has impressive YoY growth, but still operates on a very different scale where much of that growth is driven by newcomers rather than veteran systems engineers seeking an alternative.
Makes me wonder how much of all the heated discussions around Rust vs C++/EverythingElse is actually grounded in real experience and knowledge of both sides...
Language audience composition and net growth
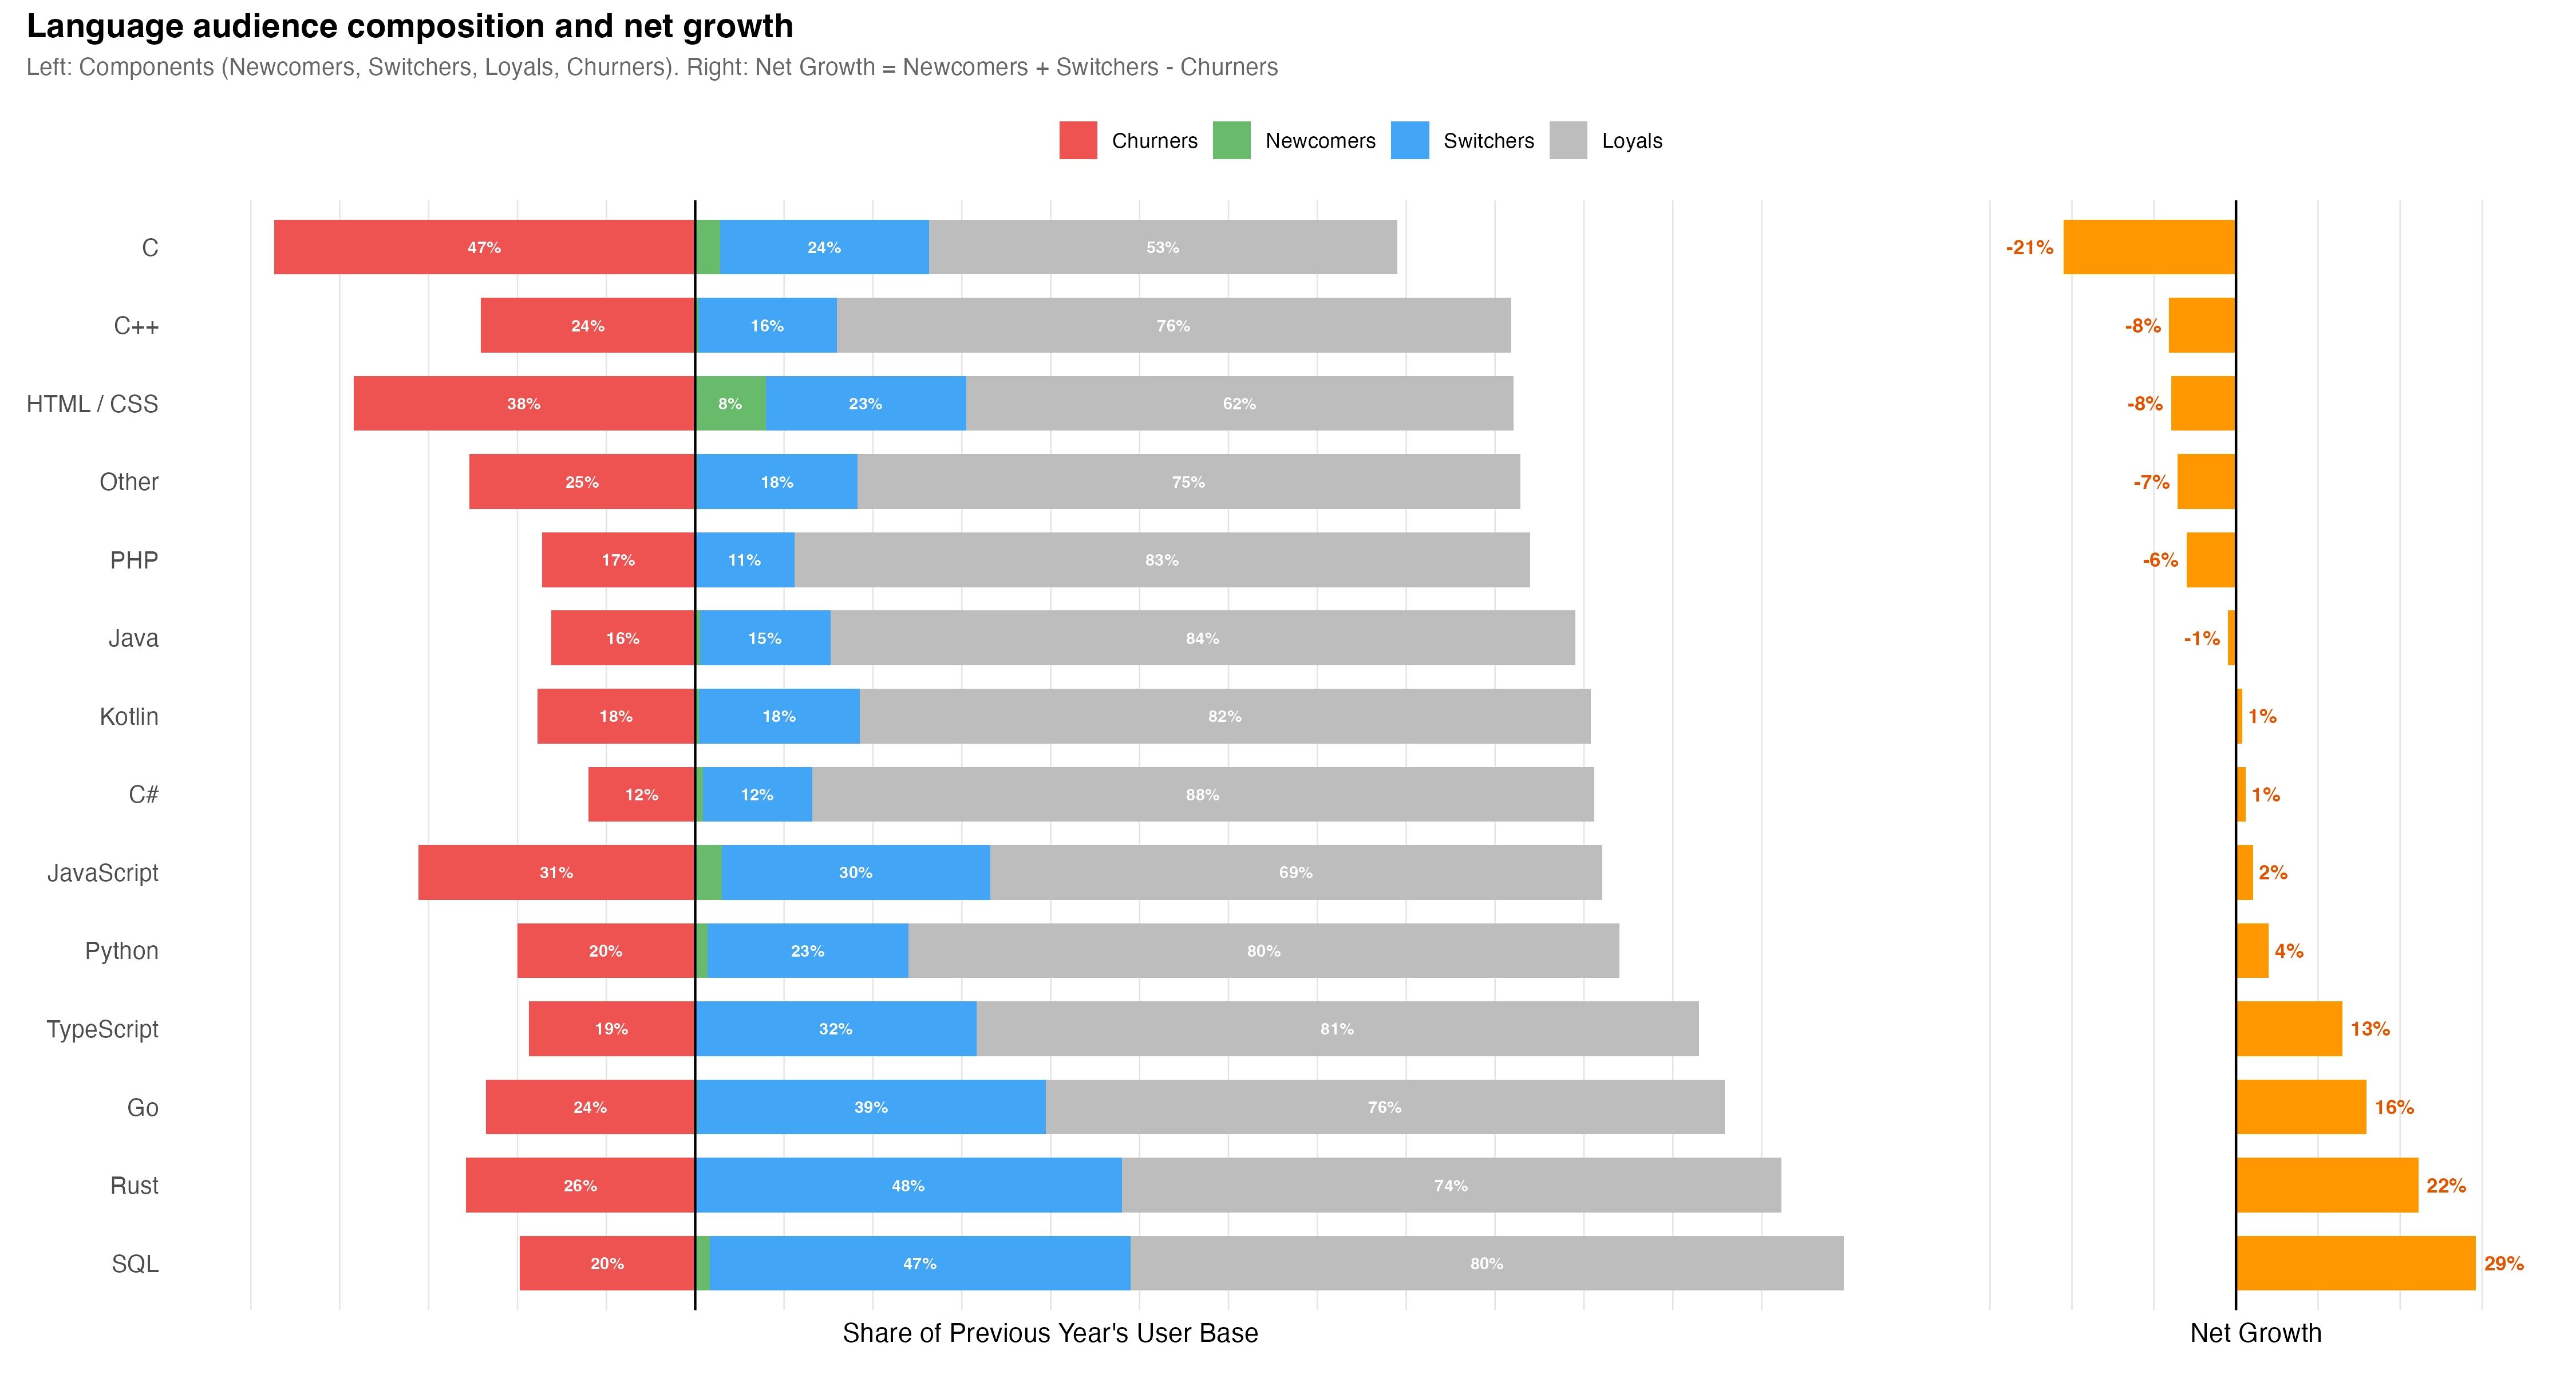
| Language | Churners | Newcomers | Switchers | Loyals | Net growth |
|---|---|---|---|---|---|
| C | 47% | 2% | 24% | 53% | −21% |
| C++ | 24% | 0% | 16% | 76% | −8% |
| HTML / CSS | 38% | 7% | 23% | 62% | −8% |
| Other | 25% | 0% | 18% | 75% | −7% |
| PHP | 17% | 0% | 11% | 83% | −6% |
| Java | 16% | 0% | 15% | 84% | −1% |
| Kotlin | 18% | 1% | 18% | 82% | +1% |
| C# | 12% | 1% | 12% | 88% | +1% |
| JavaScript | 31% | 3% | 30% | 69% | +2% |
| Python | 20% | 1% | 23% | 80% | +4% |
| TypeScript | 19% | 0% | 32% | 81% | +13% |
| Go | 24% | 1% | 39% | 76% | +16% |
| Rust | 26% | 0% | 48% | 74% | +22% |
| SQL | 20% | 2% | 47% | 80% | +29% |
Data source: JetBrains Developer Ecosystem Survey 2025. The audience-composition percentages are weighted survey shares, not developer counts. Net growth is newcomers + switchers − churners.
Programming language usage share by year: Java, Python, JavaScript, and more (2017–2025)
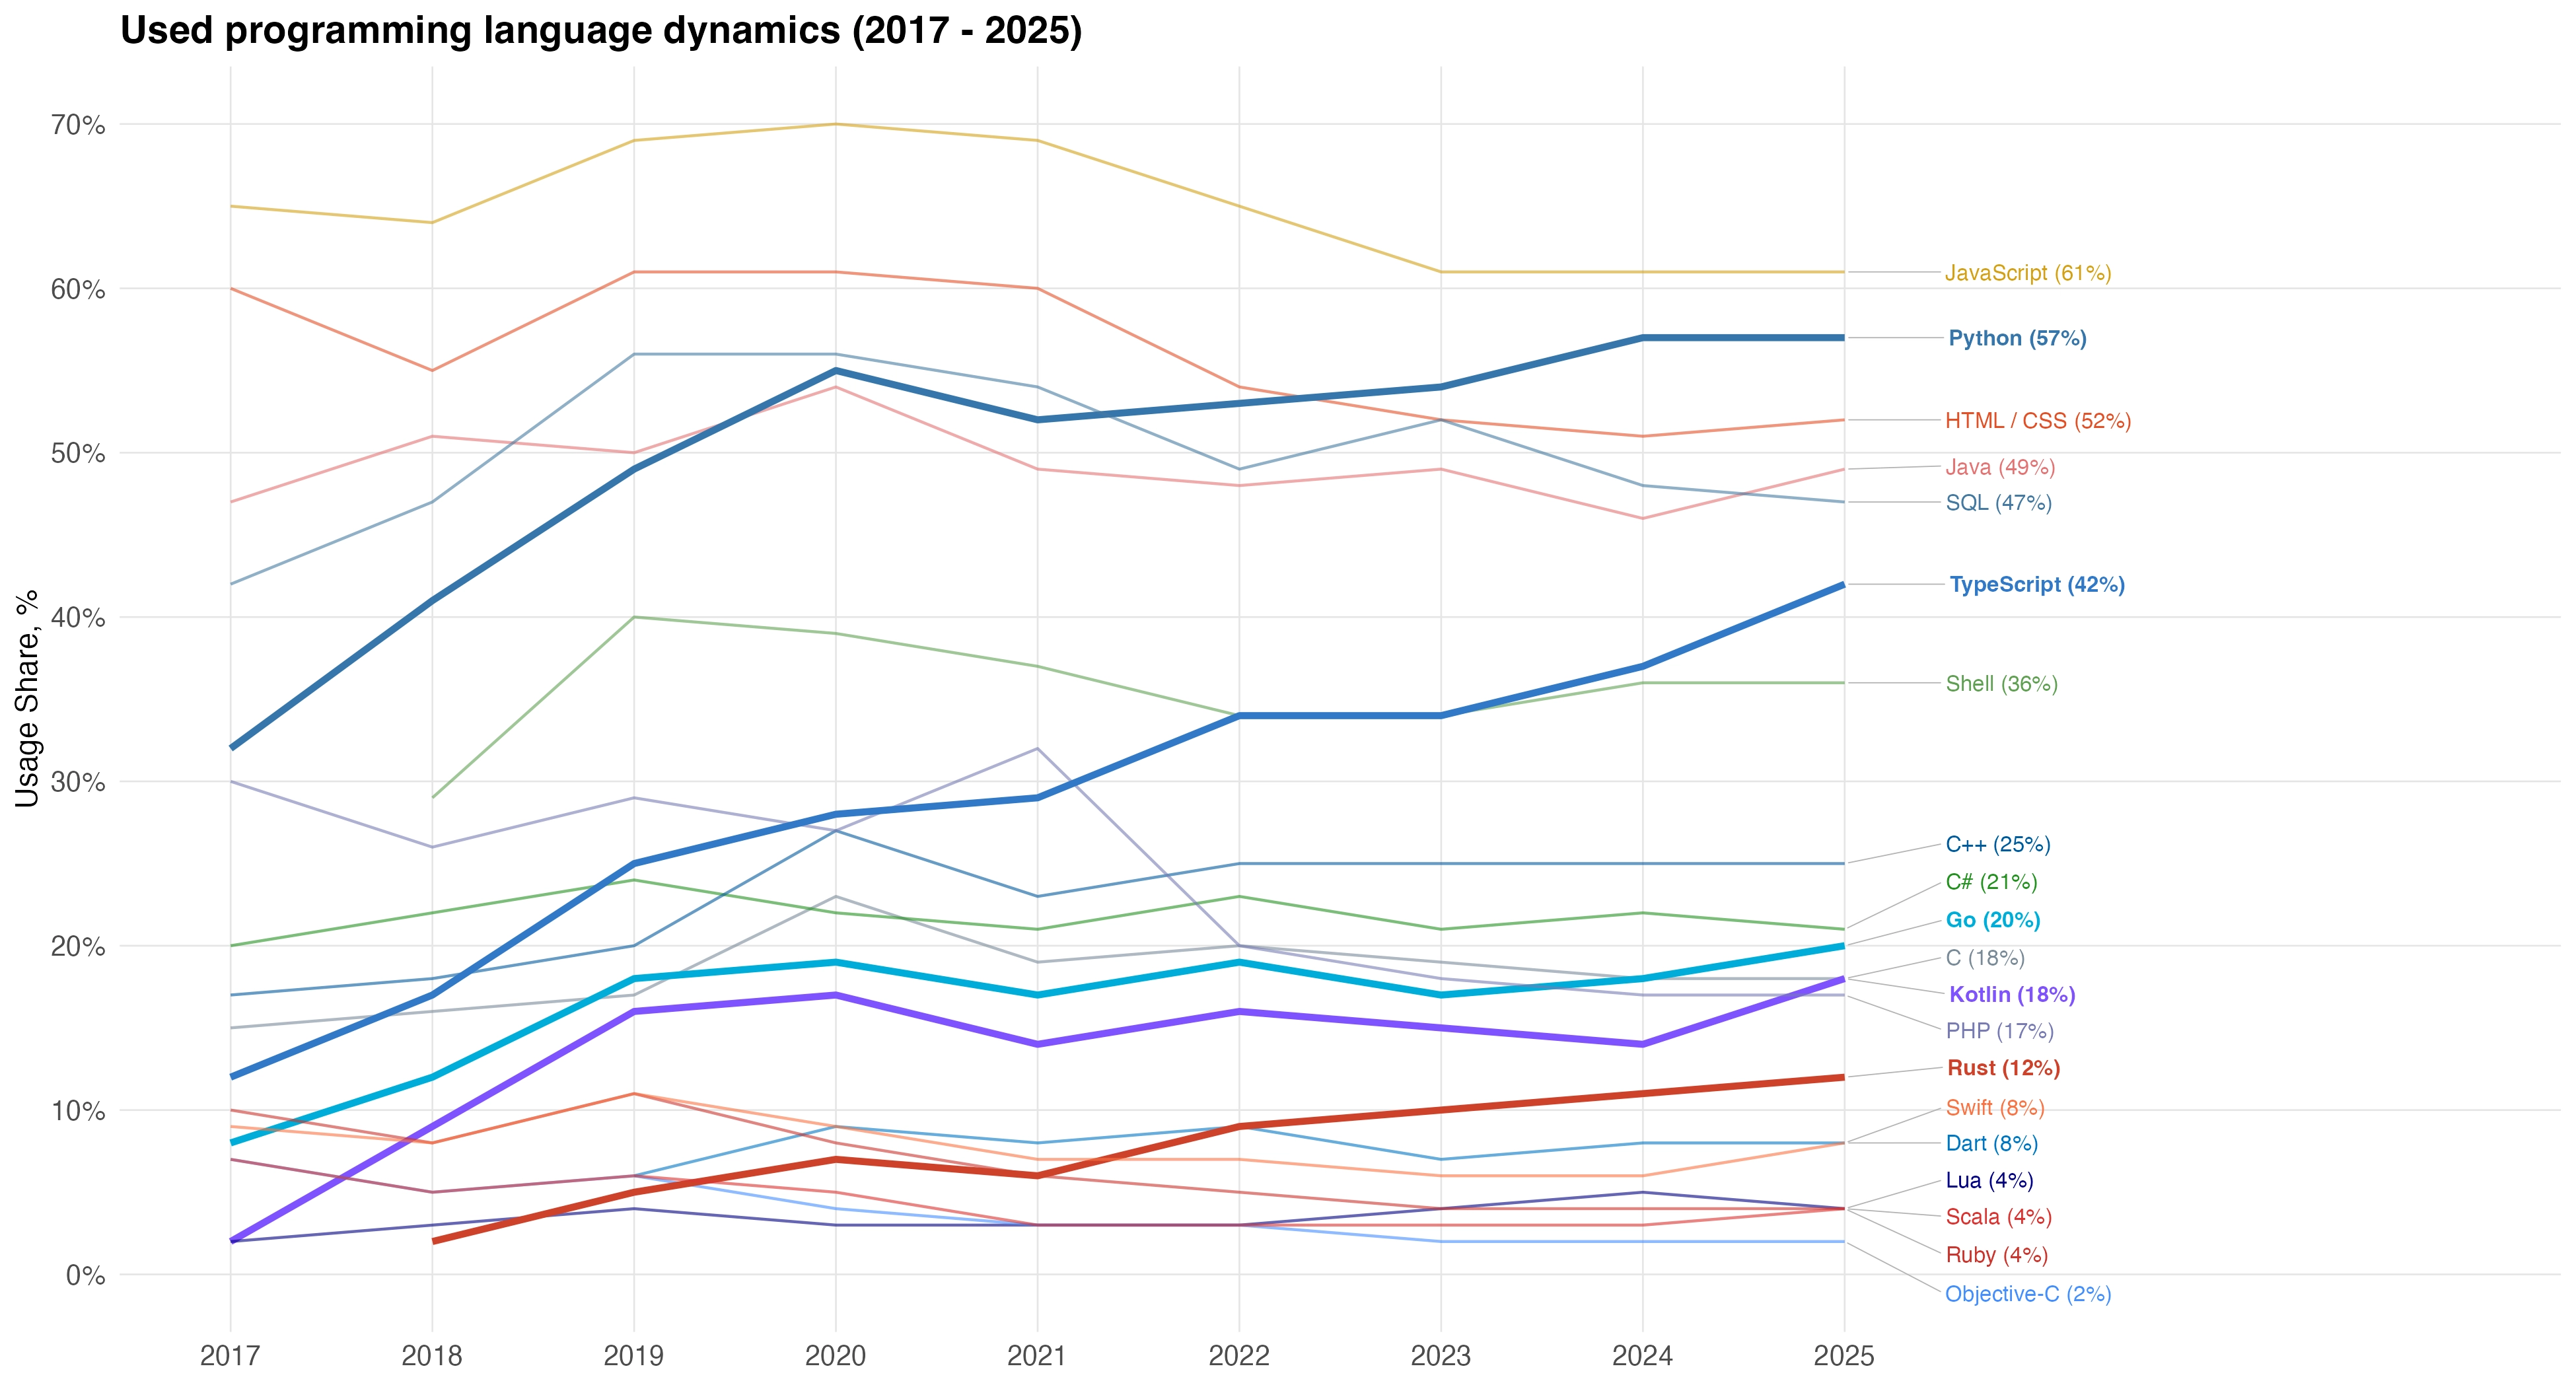
| Language | 2017 | 2018 | 2019 | 2020 | 2021 | 2022 | 2023 | 2024 | 2025 |
|---|---|---|---|---|---|---|---|---|---|
| JavaScript | 64% | 63% | 69% | 70% | 69% | 64% | 61% | 61% | 61% |
| Python | 32% | 41% | 49% | 54% | 52% | 53% | 54% | 57% | 57% |
| HTML / CSS | 60% | 56% | 61% | 61% | 60% | 53% | 52% | 51% | 52% |
| Java | 47% | 51% | 50% | 53% | 49% | 48% | 49% | 47% | 49% |
| SQL | 42% | 47% | 55% | 55% | 53% | 49% | 52% | 48% | 47% |
| TypeScript | 12% | 17% | 25% | 28% | 29% | 33% | 33% | 37% | 42% |
| Shell | — | 29% | 40% | 39% | 37% | 34% | 34% | 35% | 36% |
| C++ | 17% | 18% | 20% | 26% | 24% | 25% | 25% | 25% | 25% |
| C# | 20% | 22% | 24% | 22% | 21% | 23% | 21% | 22% | 21% |
| Go | 8% | 12% | 18% | 19% | 17% | 19% | 17% | 18% | 20% |
| C | 15% | 16% | 17% | 23% | 19% | 20% | 19% | 18% | 18% |
| Kotlin | 2% | 9% | 15% | 17% | 14% | 16% | 15% | 14% | 18% |
| PHP | 30% | 27% | 29% | 27% | 32% | 20% | 18% | 17% | 17% |
| Rust | — | 2% | 4% | 7% | 6% | 9% | 10% | 11% | 12% |
| Swift | 9% | 8% | 11% | 9% | 7% | 7% | 6% | 6% | 8% |
| Dart | — | — | 5% | 9% | 8% | 9% | 7% | 8% | 8% |
| Lua | 2% | 3% | 4% | 3% | 3% | 3% | 4% | 5% | 4% |
| Scala | 6% | 4% | 5% | 4% | 3% | 3% | 4% | 4% | 4% |
| Ruby | 6% | 5% | 5% | 8% | 5% | 4% | 3% | 3% | 4% |
| Objective-C | — | — | 5% | 4% | 3% | 3% | 2% | 2% | 2% |
Values are transcribed from the published chart and rounded to whole percentage points. A dash indicates that the series was not plotted for that year.